

Plasma price has had a rough month. After weeks of selling pressure and a lack of strong buyer support, it slipped hard into the low $0.37 range, leaving a lot of traders frustrated and unsure about its short-term direction. The broader market recovery hasn’t done much to help either, and sentiment has stayed shaky around this chart setup.
Behind the scenes, the fundamentals haven’t stood still. Plasma partnered with Cobie’s Sonar platform through Echo, which aims to streamline token sales and tighten transparency in fundraising.
Trust Wallet also integrated zero-fee USDT transfers on XPL, giving the project massive exposure to over 210 million users and opening doors in emerging markets.
On top of that, the chain still maintains a huge $6.4 billion TVL, even though early incentive emissions have weighed on price action. It’s been a weird mix of strong development and heavy sell pressure, which is why traders remain conflicted.
What the XPL Chart Is Showing
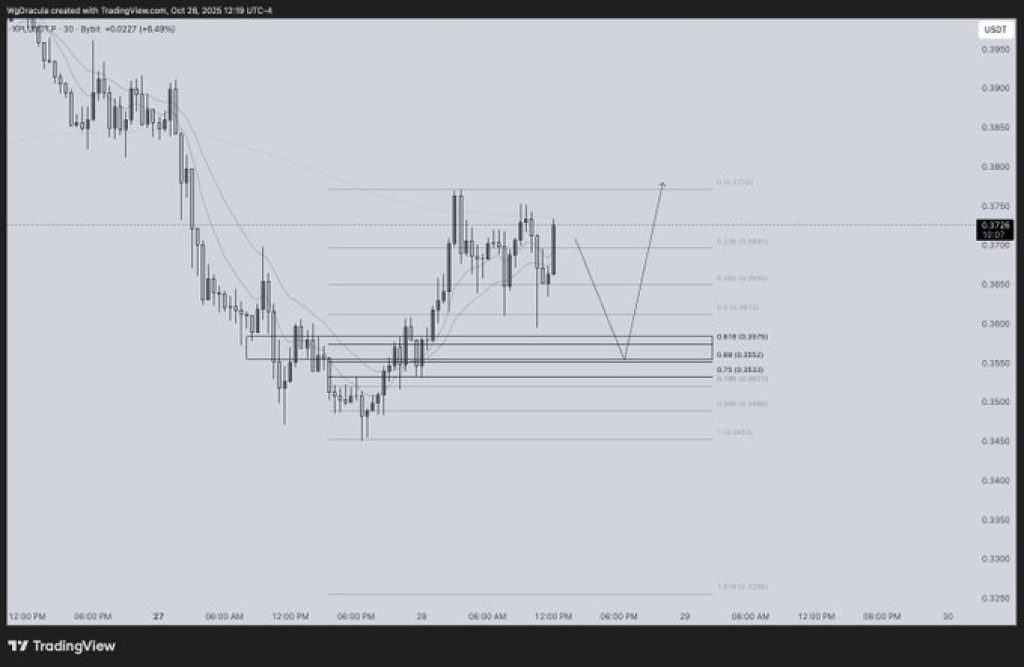
The chart shared by Trader Draco outlines a clean long scenario. The Plasma price is holding above a cluster of support levels, with several Fibonacci retracement zones underneath acting as a potential landing pad if sellers push one more leg lower.
The structure has been carving out higher lows, which is usually an early signal that sellers are losing control. Draco’s scenario suggests a sweep of liquidity deeper into that support stack, followed by a bounce toward the upper mid-range. It’s a pretty textbook accumulation setup, but timing is everything with this kind of structure.
The upper target zone sits closer to the previous reaction highs, meaning the move would require enough volume to flip short-term resistance. If buyers manage to reclaim those levels, momentum could return quickly and force sidelined traders to chase the breakout.
Read Also: Bittensor (TAO) Price Quietly Flips Its Bearish Trend – Here’s What Comes Next
Plasma Price Short-Term Outlook
If XPL holds its current support zone and sweeps lower liquidity levels without breaking structure, the chart favors a reversal toward the $0.40 to $0.43 range in the coming days.
A clean break above that area would open room toward previous mid-range highs and shift momentum back to the bulls. Failure to bounce, however, could drag the token into deeper support pockets and extend the consolidation phase.
There’s no denying how hard XPL price has been hit, but the combination of strong underlying TVL, real-world stablecoin utility, and new integrations tells a different story than the candle chart alone. If the market gives it breathing room, this setup could turn into one of those classic “washed out before the squeeze” moments.
For now, all eyes are on Draco’s support levels. One good bounce might be all it takes to wake this chart up again.
Subscribe to our YouTube channel for daily crypto updates, market insights, and expert analysis.


