

Table of Links
- Background
- Problem statement
- Model architecture
- Training data
- Results
- Conclusions
- Impact statement
- Future directions
- Contributions
- Acknowledgements and References
Appendix
5 Results
We report experimental results for a pre-trained Toto model in Section 5.1 and Section 5.2.
\
To evaluate predictions, we sequentially divide a time series into context and forecast segments. We input the context segment into Toto and autoregressively generate output patches by sampling from the Student-T mixture model distribution. We forecast a number of steps equal to the nearest multiple of the patch size, then truncate the predictions to the desired length. In order to keep inference time consistent, we vary the number of samples generated based on the cardinality and length of the dataset, with a minimum of 100 samples. We take the median sample at each time step as the final point prediction. This prediction is then compared against the ground-truth forecast segment for evaluation.
\
![Table 1. Comparison of different models with Toto on the LSF benchmark datasets. Results are averaged across prediction lengths of 96, 192, 336, and 720 steps. For Toto, we use a stride of 512 steps and a historical context window of 512 steps. For other models, we use the results reported in [15] and [19]. Metrics for each prediction length are available in Table A.2. *TimesFM only reports values for MAE on ETTh1, ETTh2, ETTm1, and ETTm2. Key: Best results, Second-best results.](https://cdn.hackernoon.com/images/null-cz034ta.png)
\
5.1 LSF benchmarks
\
To assess general-purpose time series forecasting performance, we use the Long Sequence Forecasting (LSF) benchmark datasets (ETTh1, ETTh2, ETTm1, ETTm2, Electricity, and Weather) [12]. We evaluate with forecast lengths of 96, 192, 336, and 720 time steps, in sliding windows with stride 512, and average the results. For Toto, we used a historical context window of 512 steps and took the median of 200 samples. Following standard practice, we report normalized Mean Absolute Error (MAE) and Mean Squared Error (MSE), fitted on a training split, in order to be able to compare performance across different datasets. We compared Toto’s performance with the reported results of other recent zero-shot foundation models [15, 19], as well as full-shot time series forecasting models [14, 16, 17, 36, 44–47]. We display these results in Table 1.
\
Toto demonstrates exceptional performance across a variety of benchmark datasets, excelling in zero-shot scenarios. In the LSF datasets, Toto consistently outperforms other models in terms of MAE and MSE. For example, on the ETTh1 dataset, Toto achieves an MAE of 0.389 and an MSE of 0.363, outperforming all zeroshot models, including the previously reported Moirai series and TimesFM. Macro-averaging across the six LSF datasets, Toto achieves an MAE of 0.312 and MSE of 0.265, again exceeding Moirai’s reported zero-shot performance as well as the reported performance of the full-shot models.
\
Several architectural choices and data features likely contribute to Toto’s superior performance. The novel Proportional Factorized Space-Time Attention mechanism allows Toto to efficiently capture both temporal and spatial dependencies within multivariate time series data. Additionally, the extensive training on a diverse dataset of one trillion time series points, including a mix of real-world observability metrics and multi-domain time series data, enhances Toto’s ability to handle varied characteristics of different benchmark datasets.
\
While Toto generally excels, there are areas where its performance is closely matched by other models. In full-shot scenarios, models like PatchTST, Crossformer, and FEDformer show competitive results. For example, on the Electricity dataset, while Toto achieves a leading zero-shot MAE of 0.246 and MSE of 0.157, iTransformer and TimesNet also show strong performance, indicating that these models can catch up when additional training data is available.
\
Overall, Toto’s architectural innovations and extensive training data enable it to achieve state-of-the-art performance across diverse benchmarks, excelling in zero-shot scenarios while remaining highly competitive in full-shot contexts.
\
5.2 Datadog benchmark
\
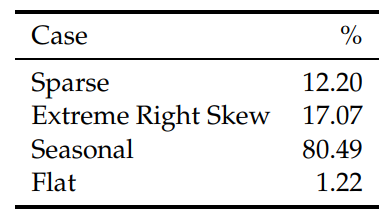
We created a benchmark using anonymous Datadog data to assess performance across various observability metrics. To ensure a representative and realistic sample, we sampled data based on quality and relevance signals from dashboards, monitor alerts, and notebooks. This benchmark comprises 983,994 data points from 82 distinct multivariate time series, encompassing 1,122 variates.
\

\
We analyzed summary statistics of the series in our benchmark to identify characteristics that make observability time series challenging to forecast. The categories and their definitions are as follows:
\
• Sparse: Series with a low density of observations, indicating infrequent recording of data or rare events.
\
• Extreme right skew: Series with a distribution heavily skewed to the right, characterized by a few very high values and many lower values.
\
• Seasonal: Series exhibiting regular and recurring patterns, often linked to daily, weekly, or yearly cycles.
\
• Flat: Series with minimal variability, showing little to no change over time.
\
The relative proportion of these cases are displayed in Table 3.
\
To assess the prediction of other zero-shot models on the DD Benchmark, we follow sampling procedures delineated in their respective manuscripts. In short, for Chronos models, we generate 20 samples and take the median prediction. For Moirai models, we take the median of 100 samples and set the patch size to “auto”. TimesFM only produces point predictions of the mean, so we use those directly. Since TimesFM and Chronos only support univariate forecasting, we process each variate independently. Moirai, on the other hand, like Toto, makes joint predictions for each group of related variates. For Toto, we utilize the same evaluation procedure we used on the LSF benchmarks.
\
The evaluation results (Table 2) demonstrate that Toto outperforms the other models. We evaluate using a prediction length of 365, the maximum forecast window available for previous time series models within the Datadog platform. We use a historical context window of 512 steps. Because observability data can have extreme variation in both magnitude and dispersion, we select symmetric mean absolute percentage error (sMAPE) as a scale-invariant performance metric [48]. We also report symmetric median absolute percentage error (sMdAPE), a robust version of sMAPE [49] that minimizes the influence of the extreme outliers present in observability data. With the lowest sMAPE of 0.672 and sMdAPE of 0.318, Toto proves to be the most accurate for forecasting observability time series data.
\
These results suggest that current open datasets may not provide sufficient information to extrapolate to the specific nuances of observability data, highlighting the importance of training on more relevant data as demonstrated by Toto’s superior performance.
\
\
:::info
Authors:
(1) Ben Cohen (ben.cohen@datadoghq.com);
(2) Emaad Khwaja (emaad@datadoghq.com);
(3) Kan Wang (kan.wang@datadoghq.com);
(4) Charles Masson (charles.masson@datadoghq.com);
(5) Elise Rame (elise.rame@datadoghq.com);
(6) Youssef Doubli (youssef.doubli@datadoghq.com);
(7) Othmane Abou-Amal (othmane@datadoghq.com).
:::
:::info
This paper is available on arxiv under CC BY 4.0 license.
:::
\


