

Key takeaways
- In 2025, Polkadot might reach a maximum price value of $4.92 and an average value of $4.58.
- In 2028, the DOT price is expected to range from a maximum of $15.81 to a minimum of $13.00.
- The price of Polkadot is predicted to reach a maximum value of $48.15 in 2031.
Polkadot (DOT) has shown impressive growth and resilience in a volatile cryptocurrency market, supported by its strong multichain protocol architecture, which ensures network security—and investor confidence. A major contributor to this success is the Sinai Upgrade on the Acala Network, which enhances functionality and security.
With over 32 million transactions validated in October 2024 by the Polkadot Relay Chain, the network demonstrates significant activity and utility, contributing to its substantial market capitalization. A notable increase in unique wallets further signals growing user adoption and engagement, strengthening Polkadot’s position as a leading blockchain platform. Will DOT reach new heights soon? Let’s get into the Polkadot price prediction for 2025-2031.
Overview
| Cryptocurrency | Polkadot |
| Token | DOT |
| Price | $3.11 |
| Market Cap | $6.79B |
| Trading Volume | $274.48M |
| Circulating Supply | 1.62B DOT |
| All-time High | $55.00 Nov 4, 2021 |
| All-time Low | $2.69 Aug 19, 2020 |
| 24-hour High | $3.17 |
| 24-hour Low | $3.01 |
Polkadot price prediction: Technical analysis
| Volatility | 4.80% |
| 50-Day SMA | $ 4.04 |
| 14-Day RSI | 50.02 |
| Sentiment | Bullish |
| Fear & Greed Index | 71(Greed) |
| Green Days | 16/30 (53%) |
| 200-Day SMA | $ 4.13 |
Polkadot price analysis: DOT faces pressure as price holds between $3.01 support and $3.19 resistance
- DOT remains stuck between $3.01 and $3.19, showing market indecision as traders await a clear breakout.
- Repeated rejections at $3.19 highlight intense selling pressure and limited upside momentum.
- The $3.01 support level is holding but remains vulnerable to a break, which could trigger further downside movement.
October 29, 2025 – Polkadot (DOT) is trading at $3.11, showing a 2.08% decline in the past 24 hours. The token’s performance reflects continued volatility in the crypto market, with both retail and institutional investors closely monitoring key technical levels. Over the last trading session, DOT fluctuated between a low of $3.01 and a high of $3.19, indicating a narrow yet active trading range. Sellers appear dominant near the upper resistance zone, while buyers attempt to defend the lower boundary to prevent further losses.
Polkadot 1-day price chart: DOT bears hold control amid a narrow range
The daily chart indicates a persistent downtrend, with DOT trading below key short-term moving averages. The $3.19 resistance has repeatedly capped upward movements, confirming intense supply pressure at that level. Meanwhile, the $3.01 support level acts as a critical base, preventing a steeper decline. A break beneath this level could accelerate bearish momentum toward lower targets, while any recovery above $3.19 might indicate a shift in trend strength. Momentum oscillators show subdued buying power, suggesting that bears remain in control for now.
Price action shows an early attempt at recovery during the latter part of the trading day, but overall sentiment remains defensive. Sustaining above the $3.10 region could provide short-term relief and stabilize the pair, while maintaining this level would be crucial for attracting new buyers. If bulls manage to push DOT above $3.19, a short-term rally could follow toward $3.25. Conversely, failure to hold the current range could lead to extended sideways movement between $3.00 and $3.10 as the market awaits stronger volume confirmation.
Polkadot 4-hour price chart: DOT consolidation persists below key resistance
On the 4-hour chart, DOT shows minor recovery attempts from its session low but remains confined within a descending channel. Buyers are actively defending the $3.01 support, yet the price continues to face repeated rejection near $3.15, indicating persistent selling pressure at higher levels.

Short-term momentum indicators suggest a period of consolidation rather than an immediate reversal. A breakout above $3.19 could shift the near-term trend toward bullish territory, while continued rejection under that threshold would reinforce bearish control. Traders are now focusing on this $3.01–$3.19 range as the defining zone for DOT’s next directional move, awaiting a decisive close to establish clear market momentum.
Polkadot technical indicators: Levels and action
Daily simple moving average (SMA)
| Period | Value ($) | Action |
| SMA 3 | $4.03 | SELL |
| SMA 5 | $4.16 | SELL |
| SMA 10 | $4.23 | SELL |
| SMA 21 | $4.12 | SELL |
| SMA 50 | $4.07 | SELL |
| SMA 100 | $4.00 | SELL |
| SMA 200 | $4.11 | SELL |
Daily exponential moving average (EMA)
| Period | Value ($) | Action |
| EMA 3 | $4.11 | SELL |
| EMA 5 | $4.06 | SELL |
| EMA 10 | $4.00 | SELL |
| EMA 21 | $3.96 | BUY |
| EMA 50 | $3.94 | BUY |
| EMA 100 | $4.00 | SELL |
| EMA 200 | $4.30 | SELL |
What can you expect next for Polkadot (DOT)?
Polkadot’s short-term outlook remains neutral to bearish as it trades between $3.01 and $3.19, showing indecision among traders. A breakout from this tight range could determine DOT’s next significant move.
If buyers push above $3.19, DOT may rally toward $3.25–$3.30, signaling renewed strength. However, continued rejection below this level would likely extend the sideways trend. A drop below $3.01 could trigger further losses, potentially reaching $2.95–$2.90, which would increase selling pressure. For now, traders are watching these key levels closely to gauge DOT’s next direction.
Is Polkadot a good investment?
Polkadot remains a strong blockchain project thanks to its interoperability and parachain technology, which continue to attract developers and long-term supporters. Its fundamentals are solid, but short-term momentum is limited as DOT trades between $3.01 and $3.19, reflecting market indecision.
For long-term investors, this range could present an opportunity for accumulation, while short-term traders should remain cautious until a clear breakout occurs. Overall, Polkadot’s long-term potential remains intact; however, its near-term price movement will depend on broader market trends.
Why is Polkadot Down today?
Polkadot (DOT) is down today as selling pressure persists and market momentum weakens. The token has repeatedly failed to break above the $3.19 resistance level, leading to a 2.08% drop to around $3.11. Technical indicators suggest limited buying strength, while broader crypto market volatility, driven by Bitcoin’s consolidation, further adds to the bearish tone. Low trading volume and a lack of major ecosystem updates have also dampened investor interest. For now, DOT remains range-bound between $3.01 and $3.19; a break below support could send it toward $2.95, while a move above resistance might spark a short-term rally toward $3.30.
Recent news on Polkadot
Grayscale has updated its S-1 registration filings with the SEC for two proposed cryptocurrency ETFs—one for Cardano (ADA) to trade on NYSE Arca under the ticker GADA and another for Polkadot (DOT) to trade on Nasdaq under the ticker DOT. Both funds would hold the underlying assets directly, track CoinDesk pricing indices, and use Coinbase Custody, mirroring the firm’s existing Bitcoin and Ethereum products. The filings update earlier 19b-4 applications from February 2025, though SEC approval remains pending, with the Cardano ETF decision now delayed to October 26.
The amendments reflect Grayscale’s continued push amid a crowded field of 96 pending crypto ETF applications, including Solana, XRP, Ethereum, Bitcoin, and Litecoin. Market optimism has risen regarding the expected price for the Cardano ETF. Polymarket data show approval odds for the Cardano ETF climbing to 87%, supported by Grayscale’s renewed efforts, strong ADA performance, and recent regulatory clarity around staking that could accelerate approvals across the sector.
Will Polkadot reach $10?
Yes, according to long-term predictions, Polkadot is projected to reach up to $10 by 2027, with expectations for next week also showing positive trends.
Will Polkadot reach $40?
Yes, according to the long-term predictions, Polkadot is projected to reach up to $40 by 2031.
Will Polkadot reach $100?
Reaching $100 for Polkadot (DOT) is highly ambitious and unlikely in the near term.
Does Polkadot have a promising long-term future?
Based on Polkadot’s ongoing buying demand and positive community support, the DOT price is set to make new highs in the coming years. However, you are advised to do your research before investing in the volatile market.
Polkadot price prediction October 2025
Here are the current Polkadot price movements in October 2025. The potential low is $3.94, while the current price might average around $4.36. On the higher end, DOT could reach up to $4.48.
| Month | Potential Low | Potential Average | Potential High |
| October | $3.94 | $4.36 | $4.48 |
Polkadot price prediction 2025
The DOT price prediction for 2025 anticipates a minimum value of $4.41 and a maximum value of $4.92. The token price and the coin’s average value could be around $4.58.
| Polkadot Price Prediction | Potential Low | Potential Average | Potential High |
| 2025 | $4.41 | $4.58 | $4.92 |
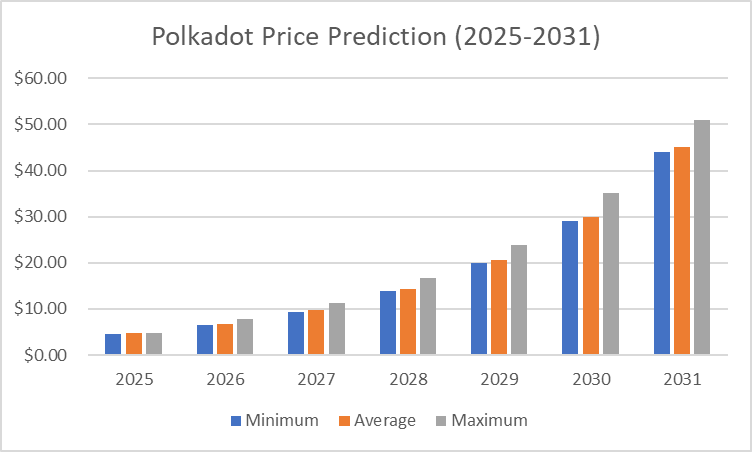
Polkadot Price Predictions 2026-2031
| Year | Minimum Price | Average Price | Maximum Price |
| 2026 | $6.17 | $6.40 | $7.91 |
| 2027 | $9.04 | $9.29 | $10.90 |
| 2028 | $13.00 | $13.37 | $15.81 |
| 2029 | $19.53 | $20.20 | $22.60 |
| 2030 | $27.42 | $28.23 | $33.83 |
| 2031 | $41.22 | $42.64 | $48.15 |
Polkadot price prediction 2026
According to the Polkadot prediction for 2026, DOT could reach a maximum price of $7.91, with the lowest price expected to be $6.17, and an average forecast price of $6.40.
Polkadot price prediction 2027
The price of Polkadot is predicted to reach a minimum value of $9.04 in 2027. Per expert analysis, DOT tokens could reach a maximum value of $10.90 and an average trading price of $9.29.
Polkadot price prediction 2028
Cryptopolitan predicts that in 2028, the Polkadot network will reach a minimum price level of $13.00, a maximum price of $15.81, and an average trading price of $13.37.
Polkadot price prediction 2029
The price of Polkadot is predicted to reach a minimum value of $19.53 in 2029. Traders can anticipate a maximum value of $22.60 while monitoring key support levels and an average trading price of $20.20.
Polkadot price prediction 2030
According to the Polkadot price prediction for 2030, DOT could reach a maximum price of $33.83, a minimum price of $27.42, and an average forecast price of $28.23.
Polkadot price prediction 2031
In 2031, Polkadot’s price is predicted to reach a minimum level of $41.22. Should positive market sentiment persist, DOT can attain a maximum cost of $48.15 and an average trading price of $42.64.
Polkadot market price prediction: Analysts’ DOT price forecast
| Firm | 2025 | 2026 |
| DigitalCoinPrice | $9.59 | $11.16 |
| Coincodex | $4.42 | $6.61 |
Cryptopolitan’s Polkadot (DOT) Price Prediction
The DOT price prediction for 2025 anticipates a minimum value of $3.94 and a maximum value of $4.92. The token price and the coin’s average value could be around $4.76. By the end of 2031, we expect the DOT price to reach a maximum level of $48.15.
Polkadot historic price sentiment
- After spending most of the second half of 2020 trading around $4-$5, the price broke above the previous all-time high of $7 on December 29 and quickly reached the Polkadot price projection of $10.

- Polkadot experienced rapid growth, with its price climbing from around $3 in January to an all-time high of approximately $57.50 in May 2021.
- After the peak, the price declined sharply, falling to around $10 by July before partially recovering to over $40 in November 2021.
- In 2022, Polkadot price steadily declined, starting the year around $30 and dropping below $10 by mid-year.
- By the end of 2022, the price stabilized near $5 as bearish market conditions dominated the cryptocurrency space.
- The price of DOT hovered between $5 and $7 for most of 2023, reflecting a period of consolidation and limited market excitement.
- In January 2024, Polkadot’s price remained relatively stable, trading around the $5–$6 range.
- By July 2024, Polkadot showed slight signs of recovery, with its price rising to around $7–$8. This modest uptick was likely driven by increasing market interest.
- In December 2024, Polkadot showed signs of recovery, with its price climbing to around $10.4.
- In January 2025, Polkadot peaked at $7.98 but lost momentum towards the end of the month, resulting in a trading range of $4.64 to $5.28 in February.
- In March 2025, Polkadot (DOT) traded at approximately $4.30.
- In April 2025, Polkadot (DOT) experienced a gradual downtrend, with its price hovering slightly below the $4 mark amid ongoing market volatility.
- In May, Polkadot (DOT) began trading at around $ 4.10 and exhibited moderate fluctuations. As of the latest update, the price has declined slightly and is currently hovering near $ 3.90, reflecting a mild bearish trend so far.
- Polkadot (DOT) declined from a high of around $4.20 to approximately $3.30 in June, with a consistent downtrend and brief rebounds near $3.60 in July.
- In August 2025, Polkadot traded around $4.10, maintaining a steady pace with limited volatility. The price slightly dipped during September 2025, hovering near $4.00 as market sentiment remained neutral.
- By October 2025, DOT showed mild recovery, trading near $4.30, suggesting cautious accumulation among traders amid broader market stabilization.


