
 Price Breaks Below 2-Year Support Level as Bearish Outlook Worsens")
The Kaspa chart has officially broken below a critical support level that held firm since November 2023. The technical setup now paints a clearer bearish picture as market structure weakens further.
The latest daily chart shows KAS price trading around $0.00512, confirming a decisive move below the two-year support zone near $0.00513. This breakdown reflects sustained selling pressure that has outweighed recent developer progress and market optimism.
Kaspa Price Chart Breakdown And Technical Observation
The long-term chart reveals how the $0.00513 area served as a major demand zone for several months. Multiple retests of this level between late 2023 and mid-2025 showed consistent buyer reactions. The recent breach, however, marks the first clean breakdown since that zone was established. A new lower low has now formed, aligning with a series of descending highs seen since July 2024.
Downward candles have appeared with higher volume while rebounds have shown weaker participation. This pattern indicates active selling and passive buying. Such behavior often validates a continuation of the downward trend rather than a quick recovery.
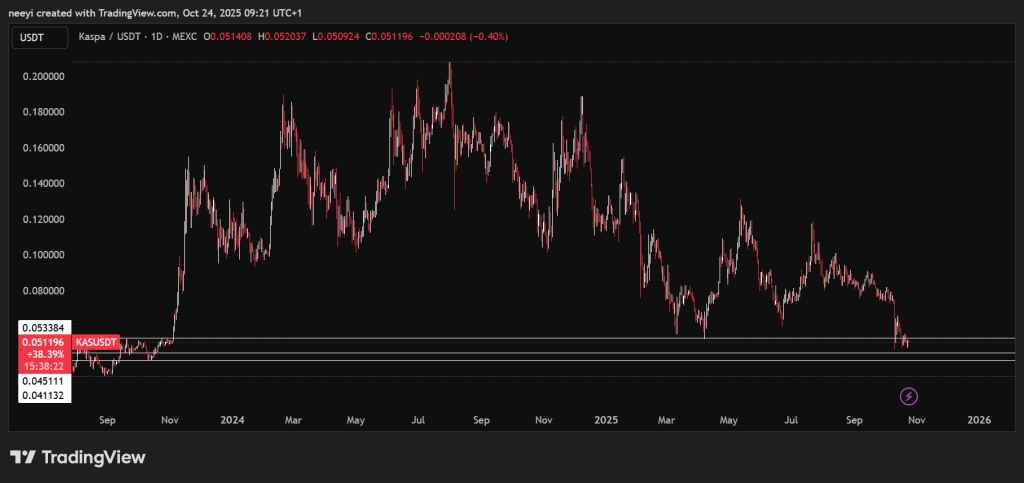
Price action analysis suggests that $0.00513 may now turn into a resistance level. As long as KAS price remains below this threshold, market momentum will likely favor sellers. Potential lower targets include the $0.0045 and $0.0041 regions, which mark the next visible support zones on the daily timeframe.
KAS Price Indicators Table And Summary
The following table summarizes the daily technical indicators for Kaspa, based on Investing.com data. Each reading shows how the market momentum currently aligns with the bearish outlook.
| Name | Value | Action |
|---|---|---|
| RSI(14) | 34.134 | Weak momentum with sellers dominating; not yet at extreme oversold levels. |
| STOCH(9,6) | 23.865 | Near oversold territory, suggesting limited short-term bounce potential. |
| MACD(12,26) | -0.007 | Negative crossover, confirming downward momentum. |
| ADX(14) | 47.923 | Strong trend reading; indicates firm bearish control. |
| ROC | -7.546 | Negative rate of change, showing continued selling momentum. |
| Bull/Bear Power(13) | -0.009 | Bearish dominance confirmed as sellers maintain pressure. |
Kaspa Price Indicator Analysis
The RSI reading of 34 shows weak momentum and a market still controlled by sellers. The value remains slightly above oversold levels, meaning selling pressure has not yet reached exhaustion.
The Stochastic Oscillator at 23 sits near the oversold zone. This indicates that short-term rebounds are possible, although the broader trend remains firmly bearish. Such readings often precede temporary relief rallies rather than full reversals.
The MACD value of -0.007 reflects a negative crossover, signaling that short- and long-term moving averages are diverging downward. This alignment strengthens the bearish momentum view.
ADX at 47 highlights strong trend strength. Since the directional movement index confirms the ongoing downtrend, it implies that bearish momentum has structural depth rather than being a temporary pullback.
The ROC, or rate of change, is negative at -7.546. This value supports the case that price decline continues at a measurable pace.
Bull/Bear Power remains negative, confirming that sellers dominate the recent swing highs and lows. The signal aligns with other momentum readings, reinforcing the overall bearish bias.
Together, these indicators suggest that the Kaspa market structure currently favors further downside. Momentum, volume, and trend strength align against buyers, reducing the probability of a sustained recovery without a clear reversal pattern.
Read Also: Is ASTER Worth Buying Right Now? The Price Chart Sends a Warning
Kaspa Bearish Price Outlook And Key Levels
The key level of interest remains the broken support at $0.00513. If KAS price fails to reclaim this level with strong volume, bearish continuation is likely. The next notable targets lie around $0.0045 and $0.0041, both of which have historical relevance on the chart.
A daily close above $0.00513 with rising trading volume would serve as the first sign of stabilization. Until then, the technical structure points toward a continuation of the downward movement.
Subscribe to our YouTube channel for daily crypto updates, market insights, and expert analysis.


