

Join Our Telegram channel to stay up to date on breaking news coverage
The Bitcoin price slid 2.4% in the past 24 hours to trade at $107,867 as of 1:10 a.m. EST even as Binance co-founder Changpeng Zhao, aka CZ, said it will eventually surpass gold’s $30 trillion market cap.
“Prediction: Bitcoin will flip gold,” CZ said on X. ”I don’t know exactly when. Might take some time, but it will happen. Save the tweet.”
Prediction: Bitcoin will flip gold.
I don’t know exactly when. Might take some time, but it will happen. Save the tweet. pic.twitter.com/bR4Bq0JeVE
— CZ 🔶 BNB (@cz_binance) October 20, 2025
He accompanied his statement with a chart showing Bitcoin’s current market cap at a $2.21 trillion against gold’s towering $30.3 trillion. For Bitcoin to successfully surpass gold’s valuation, the price would need to reach approximately $1.52 million.
Key US Economic Data Incoming
Economic data is likely to be key to Bitcoin’s performance this week, with jobless claims and home sales reports on Thursday giving new insights into the state of the economy.
All eyes also are on Friday’s CPI inflation report, which will be central to how Fed interest rate policy unfolds.
Meanwhile, White House economic advisor Kevin Hassett, speaking on CNBC Monday, signaled a possible end to the US government shutdown this week, suggesting a bipartisan solution is near.
So, what’s next for Bitcoin after the recent drop below $108K?
Bitcoin At Critical Juncture
The Bitcoin price is at a critical juncture on the daily chart, having dipped below $108,000 to retest a key support zone near $107,000. This follows a sharp rejection at $111,000 and a 14% drop from its recent high of $125,761.
Bitcoin is currently consolidating between $107,000 and $111,000, with the 50-day Simple Moving Average (SMA) holding above the 200-day SMA, confirming the long-term bullish trend remains intact.
The price of Bitcoin is hovering near the 0.786 Fibonacci retracement level at approximately $107,867.18. Buyers must strongly defend this zone to prevent a sharp breakdown. The Relative Strength Index (RSI), sitting at 38.98, is approaching the oversold territory, suggesting that selling pressure may be exhausted and a bounce could be on the verge.
Conversely, the Moving Average Convergence Divergence (MACD) shows a decisive bearish crossover with a negative value, confirming that sellers are currently in control. The downward volume decline further hints at cautious capital flows, reinforcing the current consolidation.
In the short term, a successful defense of the $107,000 support is important to the bulls.If buying pressure returns and the price reclaims breached resistance, the immediate target is a rebound to $110,000 (a roughly 2% gain), with a further rally aiming for the 50-day SMA at $114,278.15.
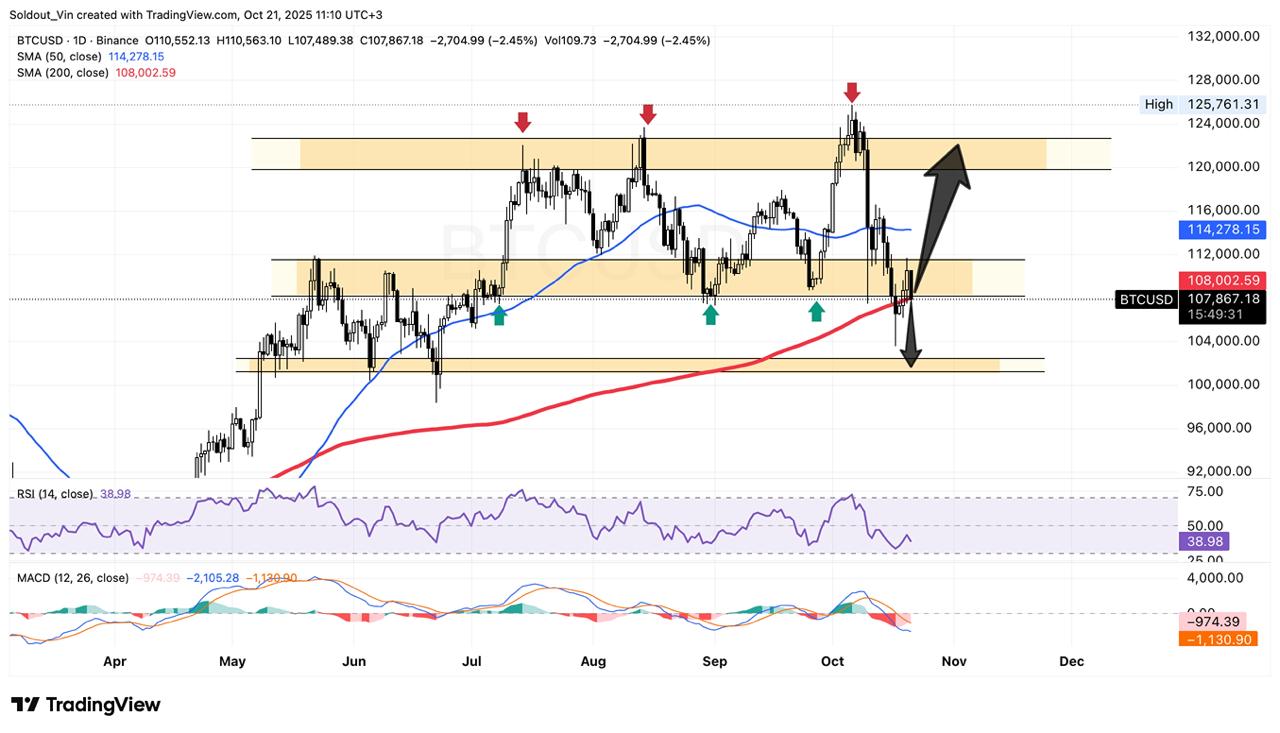
On the flipside, $107,000 serves as the first major support, with $103,000 as the next critical level if a breakdown occurs.
Related News:
Best Wallet – Diversify Your Crypto Portfolio

- Easy to Use, Feature-Driven Crypto Wallet
- Get Early Access to Upcoming Token ICOs
- Multi-Chain, Multi-Wallet, Non-Custodial
- Now On App Store, Google Play
- Stake To Earn Native Token $BEST
- 250,000+ Monthly Active Users
Join Our Telegram channel to stay up to date on breaking news coverage


