

Ethereum might be flashing a warning sign again. Crypto analyst Ali Martinez highlighted that the MVRV Momentum (160-day) just triggered a “death cross” – a bearish on-chain signal that previously preceded one of Ethereum’s steepest drops. The last time this exact setup appeared, ETH fell from around $3,300 to $1,400, a correction that played out over several weeks earlier this year.
Interestingly, this signal comes just as Ethereum had one of its strongest weekends in months. The ETH price is up more than 4% in the past 24 hours, outperforming both Bitcoin and Solana, and is currently trading above $4,000. That mix of bullish price action and bearish on-chain data sets up an interesting standoff between short-term momentum and long-term risk.
The MVRV (Market Value to Realized Value) metric measures how much profit holders are sitting on by comparing the current market cap to the average price at which all coins last moved. When the MVRV Momentum (represented by a 160-day moving average) crosses below its own long-term trendline, it means holder profitability is starting to decline faster than the broader trend. Historically, that shift has often marked the beginning of deeper pullbacks.
Martinez’s chart, based on Glassnode data, clearly shows how this pattern unfolded earlier in 2025. In late January, the blue MVRV line fell below the red 160-day moving average, signaling the start of negative momentum (highlighted by the red shading on the chart). Over the next few months, Ethereum’s price steadily declined, bottoming out near $1,400 in April before recovering later in the year. By June, the MVRV flipped back into positive territory, and ETH began its next major rally, one that pushed prices to the $3,000–$4,000 range through the summer.
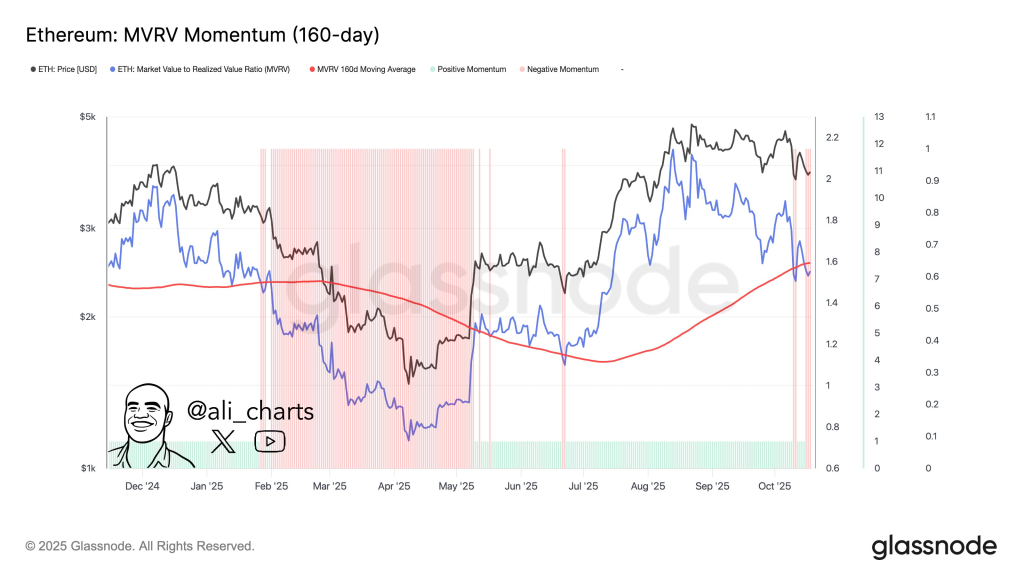
Now, in mid-October, the same setup has returned. The blue MVRV line has once again dipped below the red average, and the chart is starting to shade red again. The key difference this time is that the cross is happening from a much higher level. The 160-day moving average has been trending upward since June, suggesting that the loss of momentum is starting from a stronger base – but also that potential downside could still be big if sentiment turns.
The chart also shows that these momentum phases don’t flip quickly. The last negative cycle lasted roughly four months before conditions improved, meaning that if history rhymes, Ethereum could face an extended cooling period before regaining bullish footing.
When MVRV momentum turns negative, it typically means a larger share of the supply is approaching breakeven or loss territory. That tends to reduce investor confidence and limit buying pressure, even as traders look for new entry points. However, ETH’s current resilience above $4,000 indicates that short-term enthusiasm (fueled by weekend strength and fresh capital inflows) could delay or soften any drawdown.
If Ethereum stays above $3,700–$3,800, that would indicate strong support and could neutralize the bearish implications of the cross. A decisive close above $4,200–$4,300 might even invalidate it entirely, turning the move into a “fake-out.” On the other hand, losing those support zones could confirm that the signal is once again accurate, potentially setting up a deeper retracement similar to the one seen earlier this year.
For now, Ethereum’s chart tells a story of conflicting signals, short-term strength versus long-term caution. The price action looks healthy, but on-chain data warns that momentum might be fading beneath the surface. Traders may want to stay alert: the last time this indicator flipped, Ethereum didn’t just pull back slightly – it halved in value.
Read also: Don’t Buy Ethereum – Invest in Solana Instead, Warns Top Analyst
Subscribe to our YouTube channel for daily crypto updates, market insights, and expert analysis.


 Price Up Today?")
